Portfolio of Martijn Schrage
Below is a selection of projects I have worked on in the past few years. For a complete overview, see my C.V..
React lifecycle visualizer npm package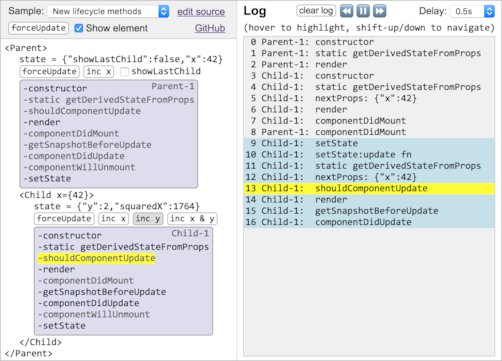
Inspired by StackOverflow questions about React's new lifecycle methods, I've create a package for easily tracing and visualizing the lifecycle of arbitrary components. The traceLifecycle HOC traces a component and causes its lifecycle methods to show up in an animated log. A StackBlitz playground is available to experiment with new (and old) lifecycle methods.
GitHub: Oblosys/react-lifecycle-visualizer (1200+ stars)
npm: react-lifecycle-visualizer
Update: React-lifecycle-visualizer has made the list of amazing React open-source tools of 2018 by Mybridge, was chosen tool of the year 2018 by the React Status blog, and was listed number 5 in this list of 22 miraculous tools for React developers in 2019!
Interimreview.nl website
For the consultancy agency Veranderkracht, I built a review website for interim professionals. The website was initially built using a MEAN stack with TypeScript only for the server, but in a subsequent project the Angular front-end has been rewritten to React/Redux and TypeScript. Though still a prototype, the site features permission-based authentication, autonomous user registration with e-mail verification, paginated search, and a responsive design. The implementation of the RESTful api makes heavy use of Bluebird promises, and Mongoose for typed MongoDB queries.
url: https://www.interimreview.nl
List-edit package for Atom
List-edit is a package for the Atom editor that I wrote in CoffeeScript. For more information and a live demo, see the List-edit page on this site.
RFID positioning of museum visitors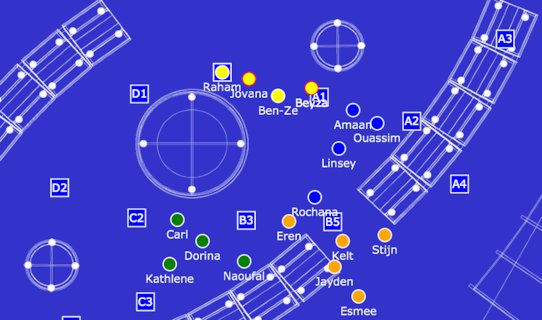 Click for animation (7.3Mb)
The Cercando project was a cooperation between the Natural History Museum Rotterdam, Rijksuniversiteit Groningen, and several companies. The goal of the project was to use real-time RFID positioning to gather information on how museum visitors move through an exhibition, as well as provide interaction with the exhibition through lighting, sound, and information terminals. I was hired to figure out how to determine the position of a visitor carrying an RFID tag from the strength of the antenna signals and build the software to compute, record and visualize these positions.
The scope of the project ranged from physical experiments to determine the RFID signal characteristics to creating D3 visualizations of visitor movement. This image shows an overview of the architecture. A multi-threaded buffered Java server handles the low-level communication with the RFID readers and relays the real-time signal strength data to a Node.js/TypeScript web server. The web server computes and stores the actual visitor positions. To compute the positions, I had to develop an incremental trilateration algorithm, as ordinary trilateration does not gracefully degrade in the presence of distortions, and gets tricky for more than three antennas.
Despite the fact that the antennas were not ideally placed and the entire exhibition was made out of metal (which reflects RFID signals), the system worked surprisingly well. This animation (7.3Mb) from the first field test shows four small groups of school children walking around on the exhibition floor. The system is currently operational in the exhibition Pure Veerkracht at the Natural History Museum Rotterdam.
All code is available on GitHub, but due to the limited budget and rather ambitious scope of the project most of the code never made it out of the proof-of-concept state.
JavaScript restaurant reservations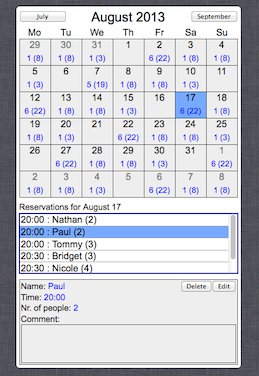
To polish up my JavaScript skills, I implemented a small web application for managing reservations at a restaurant. Though small, the application is surprisingly complete. It consists of a calendar page for viewing and managing reservations, as well as a page that clients can use to make new reservations. Everything is updated in real time, so if a client considers making a reservation on a certain day, and a time slot on that day is filled by someone else, the corresponding button in the client app is immediately disabled. The implementation uses the JQuery, Backbone, Underscore, Node.js, Express, and Socket.io libraries, and has a generic storage layer that can use either MySQL or JSON. The source code is available on github.
Raad voor de Rechtspraak
For the Dutch council for the Judiciary (Raad voor de Rechtspraak), I have worked on the 'Koppelvlak' project (not the infamous GPS project), which was concerned with standardizing data exchange between the large number of applications used by the council. The Ampersand system was used to formalize the exact format of this data exchange.
Based on a relation-algebra model (not to be confused with relational algebra), Ampersand generates a functional specification (in the form of a pdf document) and a database. The Haskell part of my work was to fix and extend the existing Ampersand language and system so it could handle the models required for the Koppelvlak project. The other part consisted of creating a new web front-end for manipulating the generated databases. The front-end needed to allow users to browse and edit data, while making sure that the rules specified in the model were not violated. Simultaneous updates from other editing sessions were signaled real-time. The implementation consisted of a Haskell code generator with PHP server code and client-side JavaScript.
hiRise iPhone app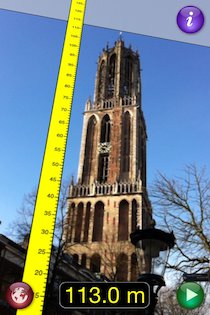
As a personal project, I have developed hiRise, an augmented-reality iPhone app for measuring the height of buildings. Because no augmented-reality libraries were availabe at the time, I had to implement all functionality from scratch. A large part of the effort went into dealing with inaccurate and, in some cases, slow sensors in the phone. Because the gyroscope tends to drift over time, it needed to be stabilized by with data from the much slower and more noisy compass. The resulting augmented-reality rendering turned out quite responsive and fluid.
ALIVE project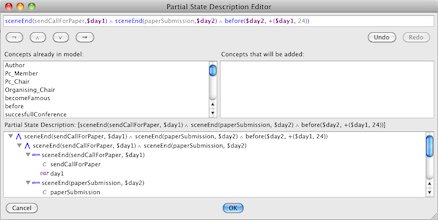
Utrecht University hired me as a scientific Java programmer for the European research project ALIVE, which was concerned with creating a framework for using model-driven design and agent technology for creating flexible service-oriented systems. I worked mainly on the Operetta toolkit, developed in Utrecht.
Part of the work consisted of improving the buggy existing code base and integrating it with other tools of the project. I also designed and implemented several graph editors, using the Eclipse EMF and GMF frameworks, as well as a textual formula editor, which provided syntax coloring and showed the formula structure while editing.
Piglet 2.0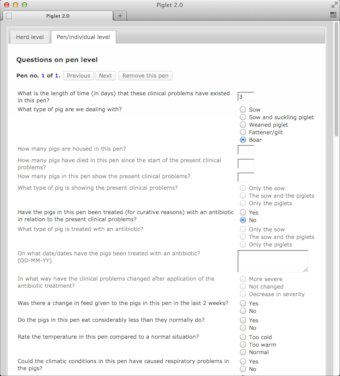
For a research project regarding the early detection of swine fever the Central Veterinary Institute hired me to develop a web application for collecting data. Vets in several countries needed a web interface to submit data they gathered from visits to pig farms. The application need to support user management and multiple languages. A complicating factor in this application was that the answers to certain questions could affect whether other questions were enabled or not. For example, only if a pig had been treated with antibiotics, a question about effectiveness of the treatment would be enabled. In some cases these dependencies spread across chains of several questions.
The client side for Piglet 2.0 was implemented in JavaScript with JQuery, and the server was written in Haskell, since this was before libraries like Node.js existed.
Dazzle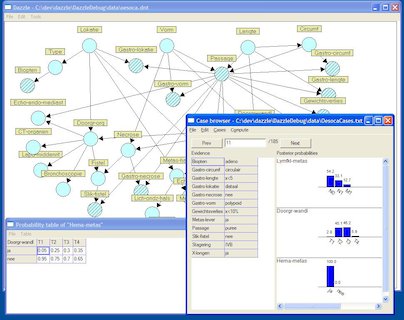
Between my PhD and Oblomov Systems, I spent four years at Utrecht University as a scientific programmer for the Decision Support Systems group. My main task was the development of the Bayesian network toolkit Dazzle, which is written in Haskell. Besides Haskell development, the work also included the development of a Pocket PC application for data collection by vets in the field. This application, called Piglet, was written in C#. Piglet served as the base for the international web-based Piglet 2.0.
An interesting aspect of the work on Dazzle was that algorithms usually came directly from research, in the form of high-level mathematical specifications with little attention for implementation strategies. We also put a lot of effort in designing the user interfaces of the subtools to make them as intuitive and dynamic as possible.
Even though Haskell may not have seemed an obvious choice for implementing a statistical toolkit with a graphical user interface, the project was quite successful. Dazzle hardly has any bugs, has sufficient performance, and the code base is about 5 to 10 times smaller than comparable toolkits written in Lisp or Java. Some insights that we had during the development are discussed in the Haskell Symposium paper 'Haskell ready to Dazzle the real world'.